Weekly Rig Monitor
Weekly Rig Monitor
WTI-Rig correlation gains a little ground.

Interactive Version Found Here

The Rig Monitor tracks weekly changes in the Baker Hughes Rig Count.
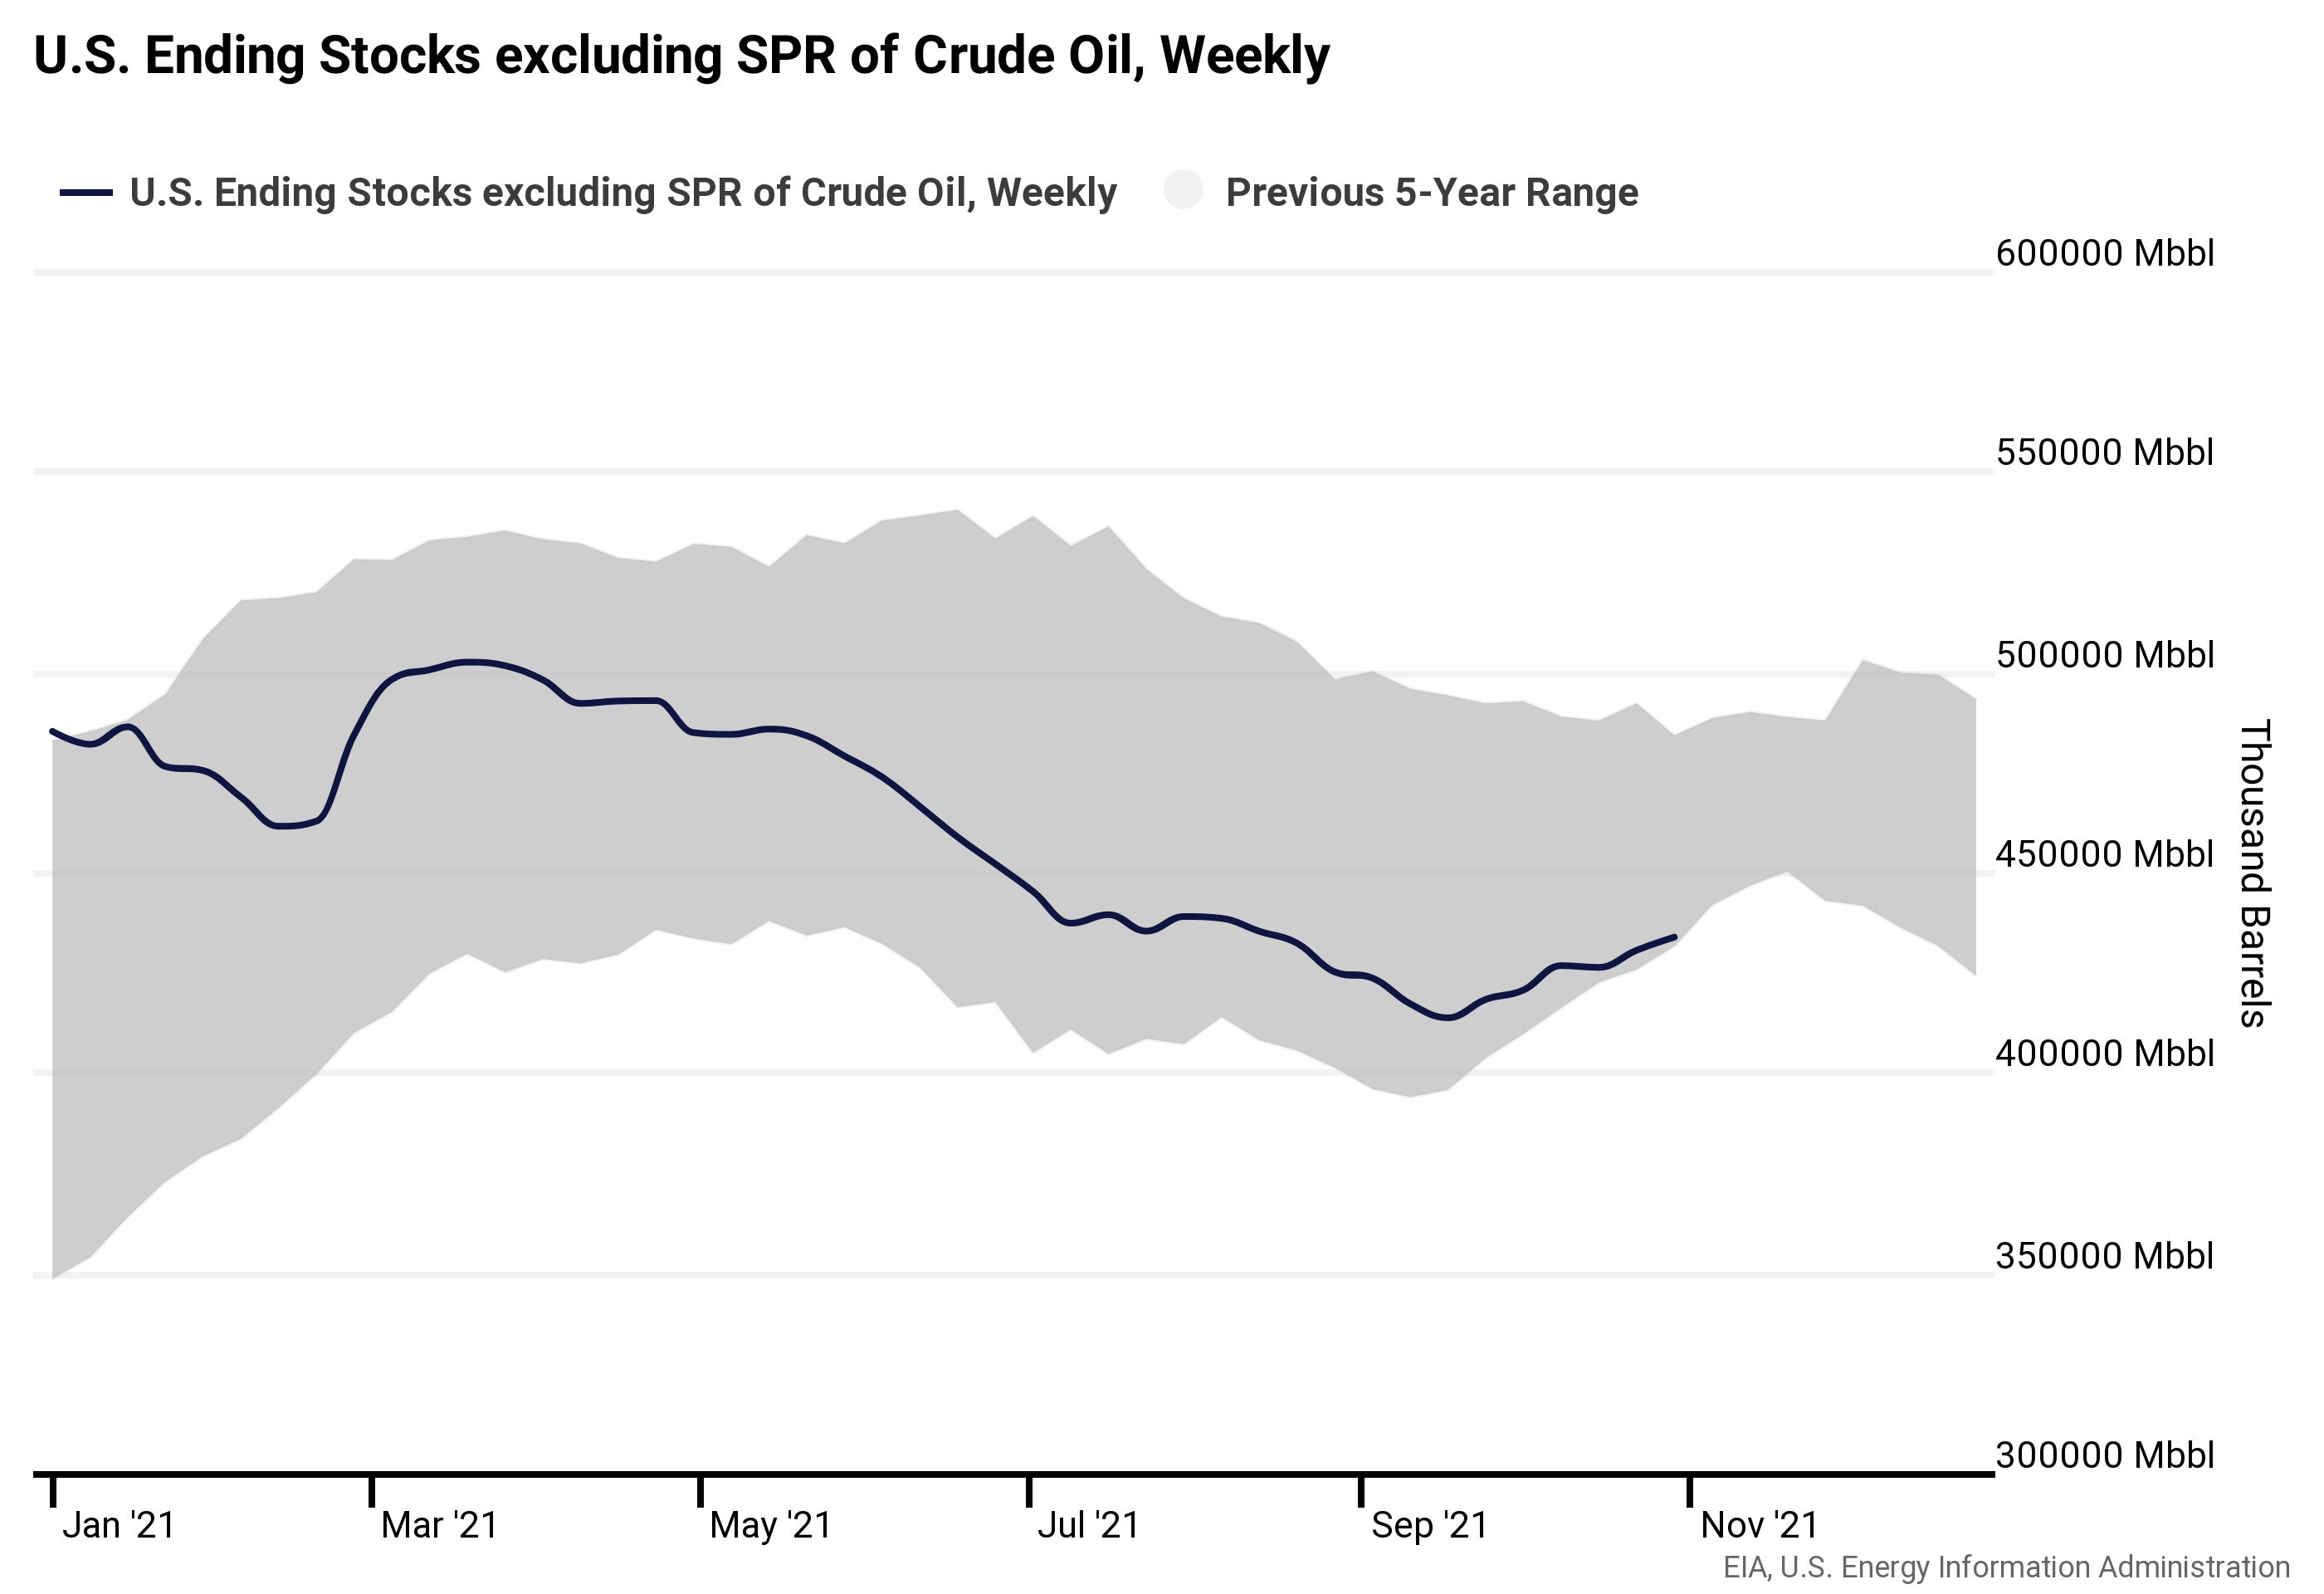
Inventories
Same trend as last few weeks, getting very close; next week is looking like the maybe point.
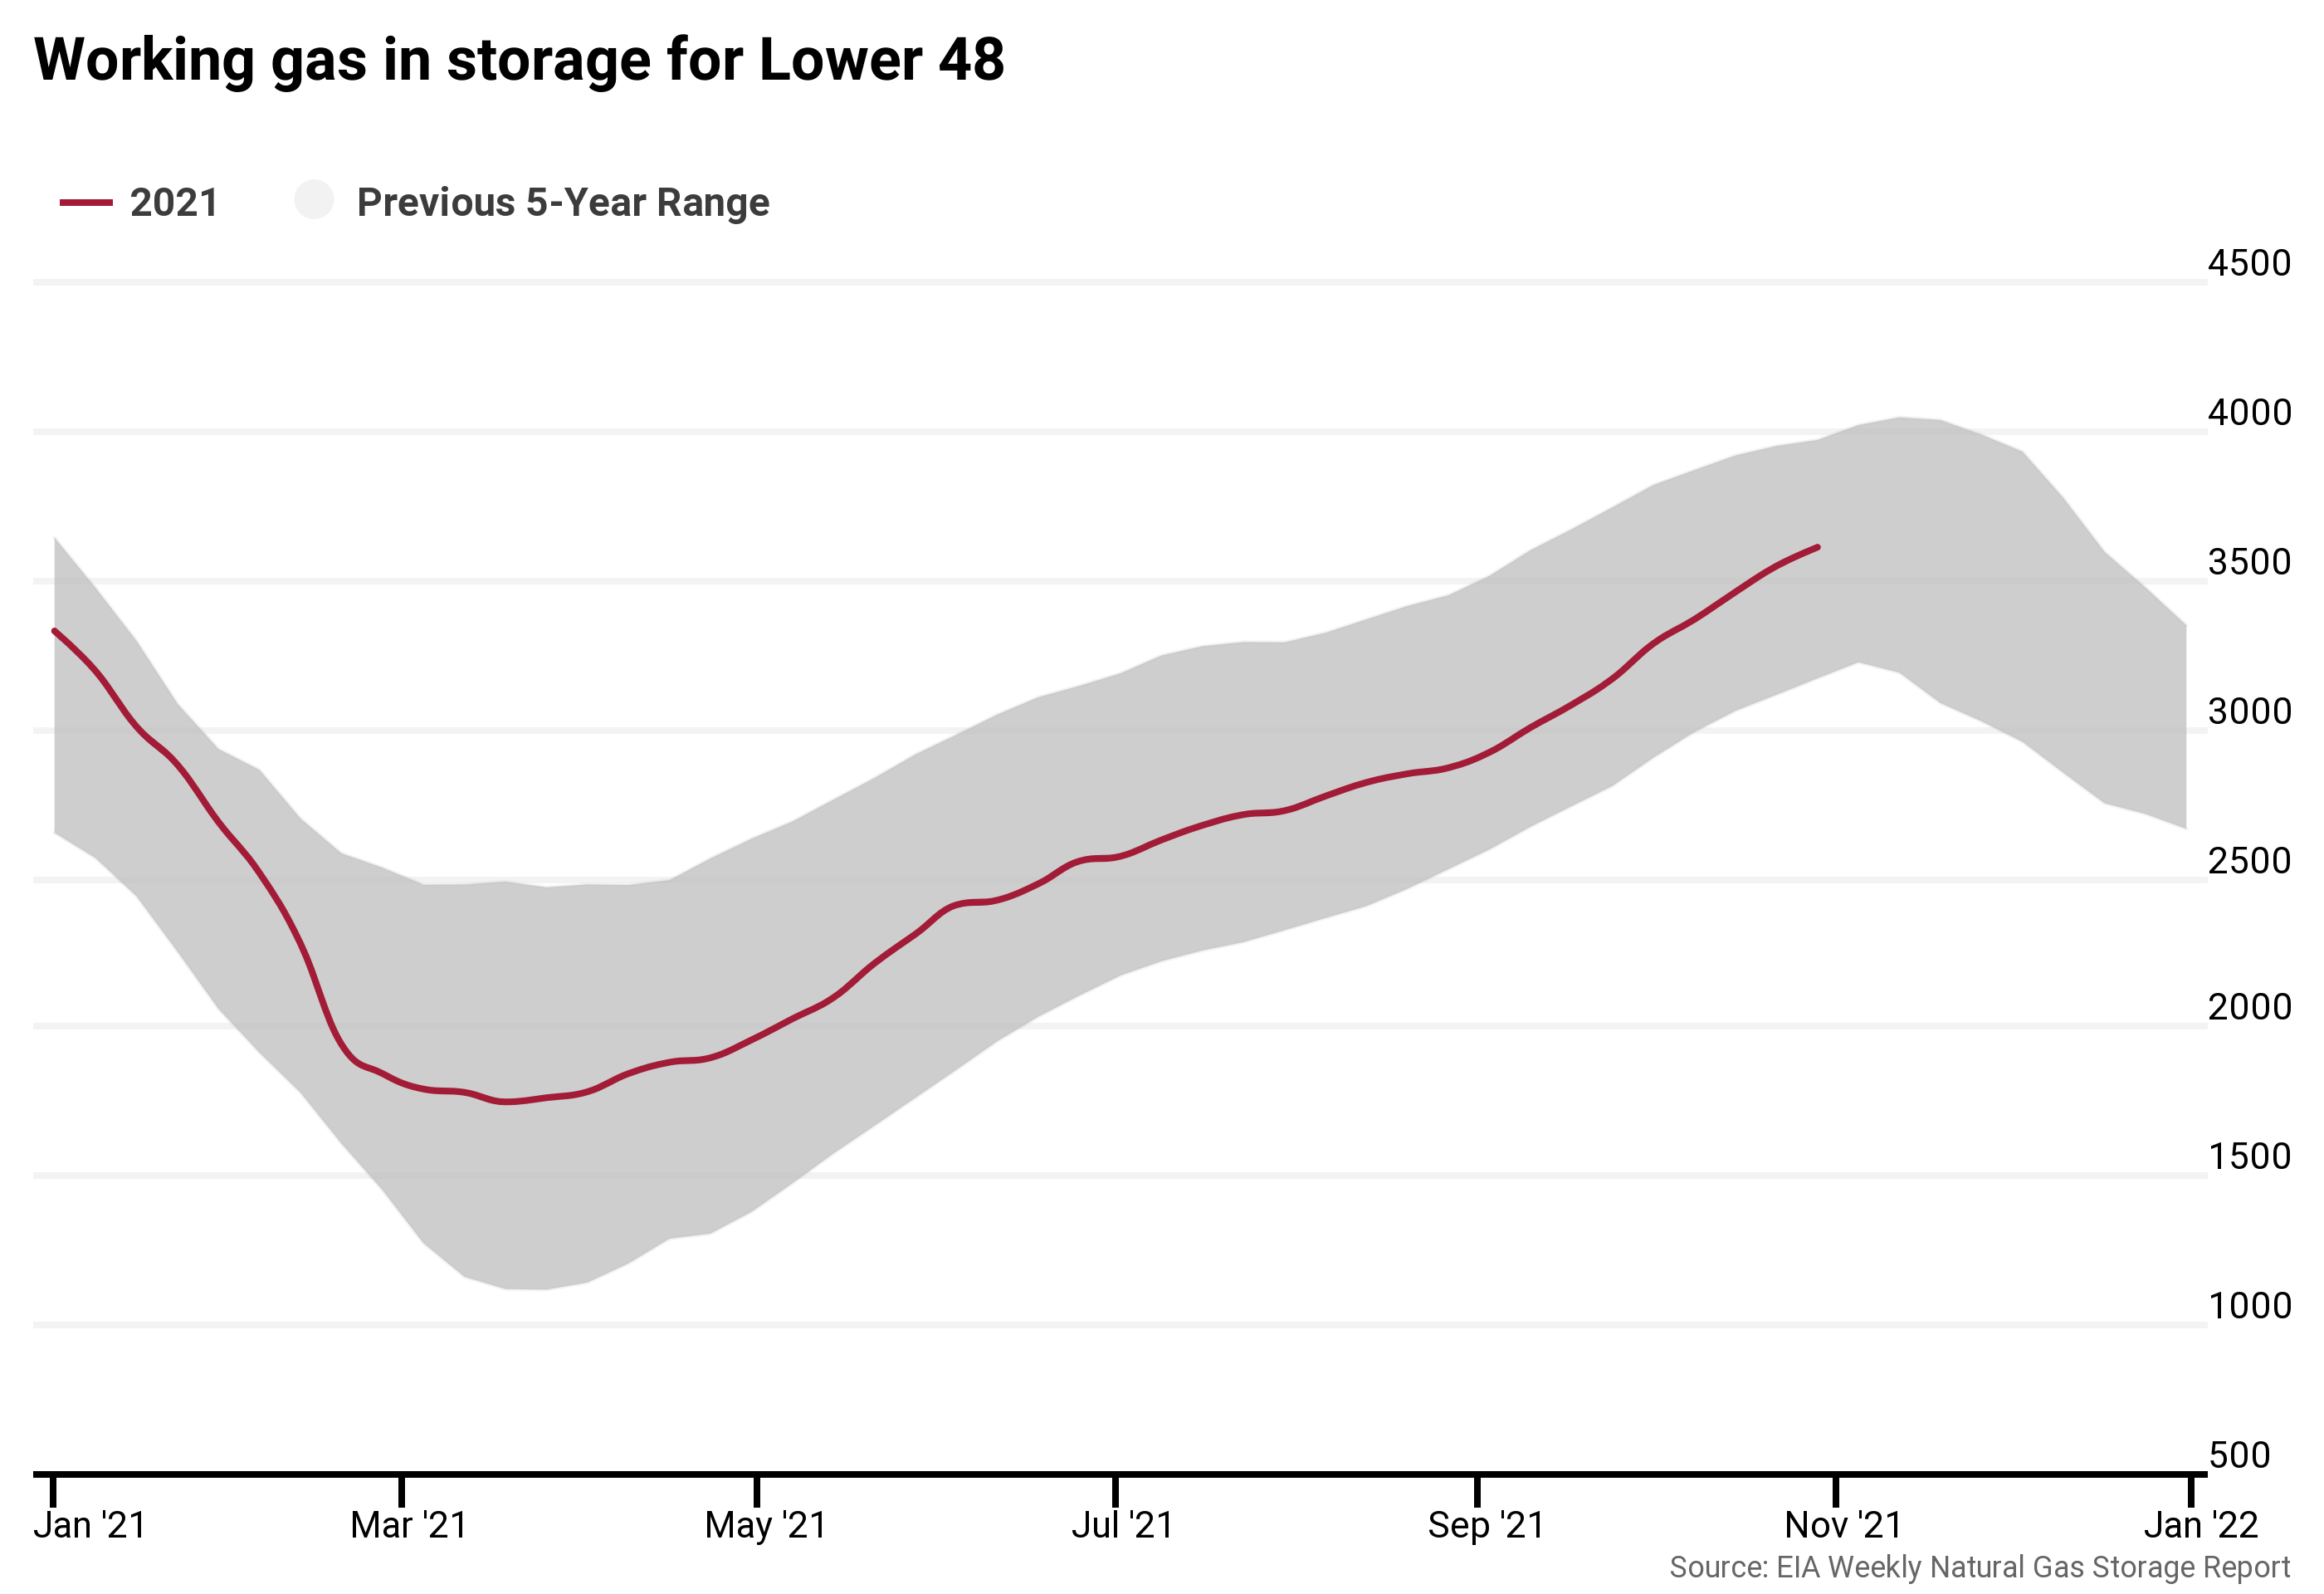
Natural gas inventories still looking like the normal range.
Rig Counts
Canada gained a couple, while the US gained 9 rigs.

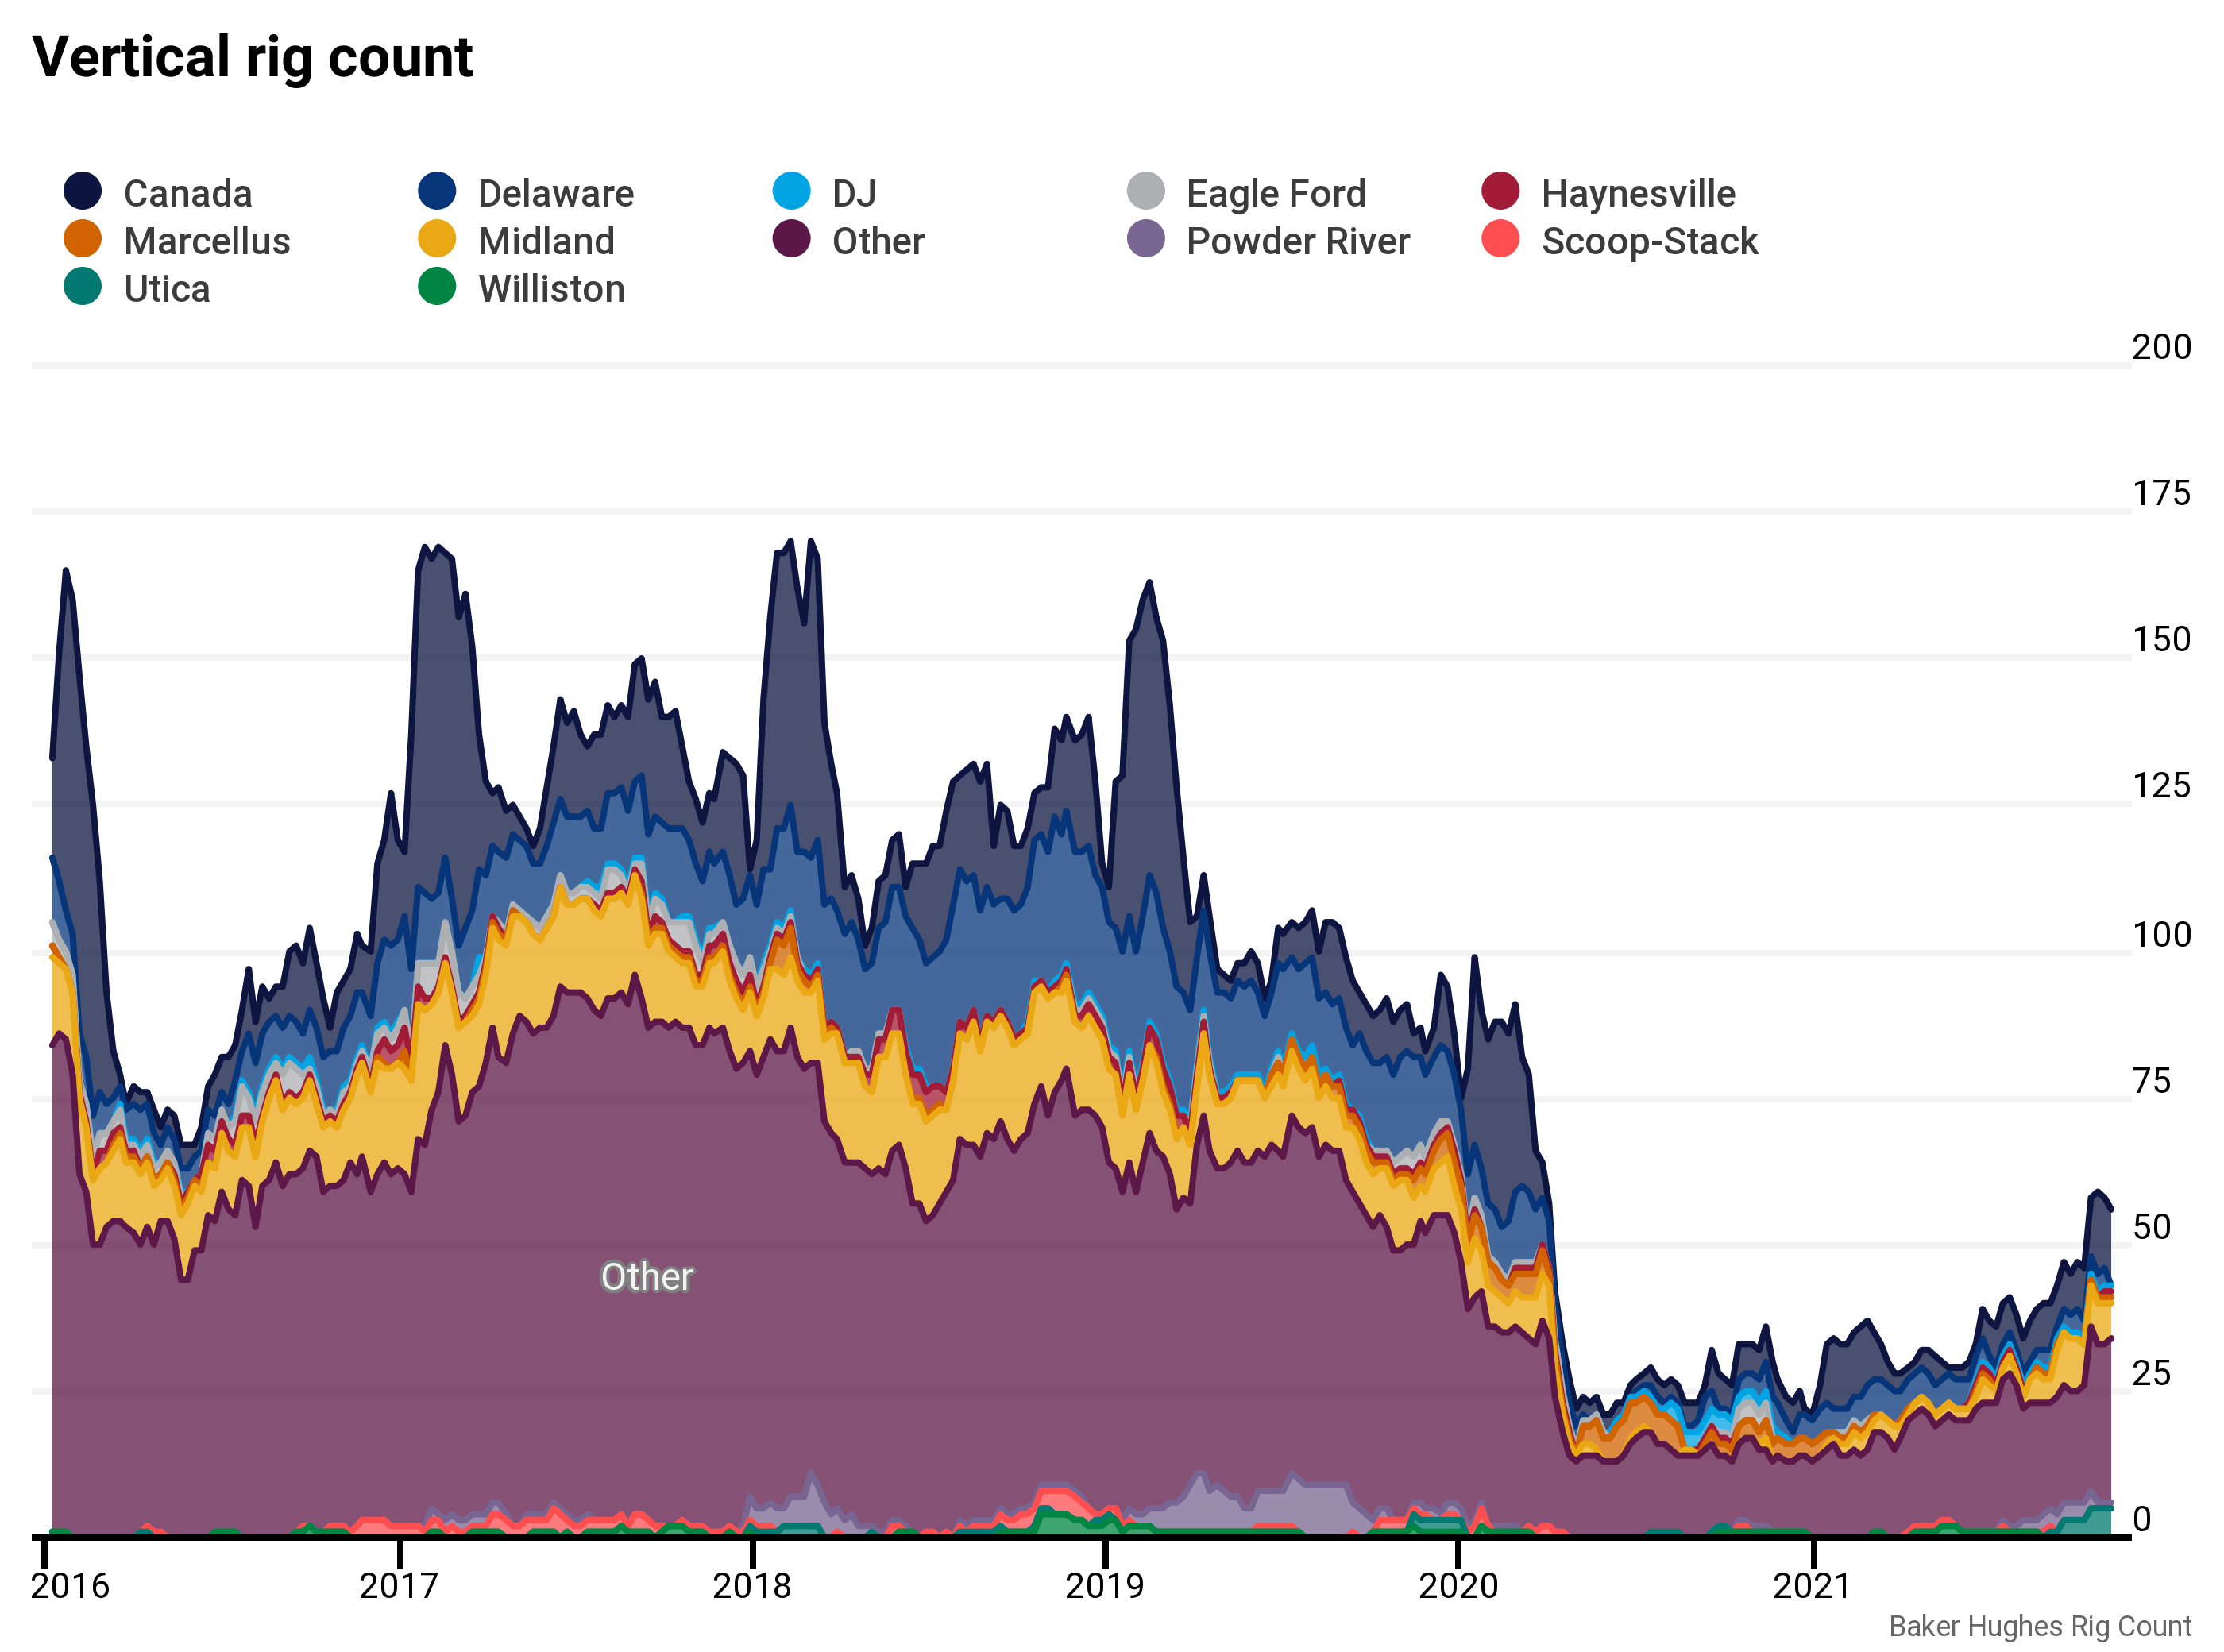
Canada was up 1, while the US lost 2 verticals.
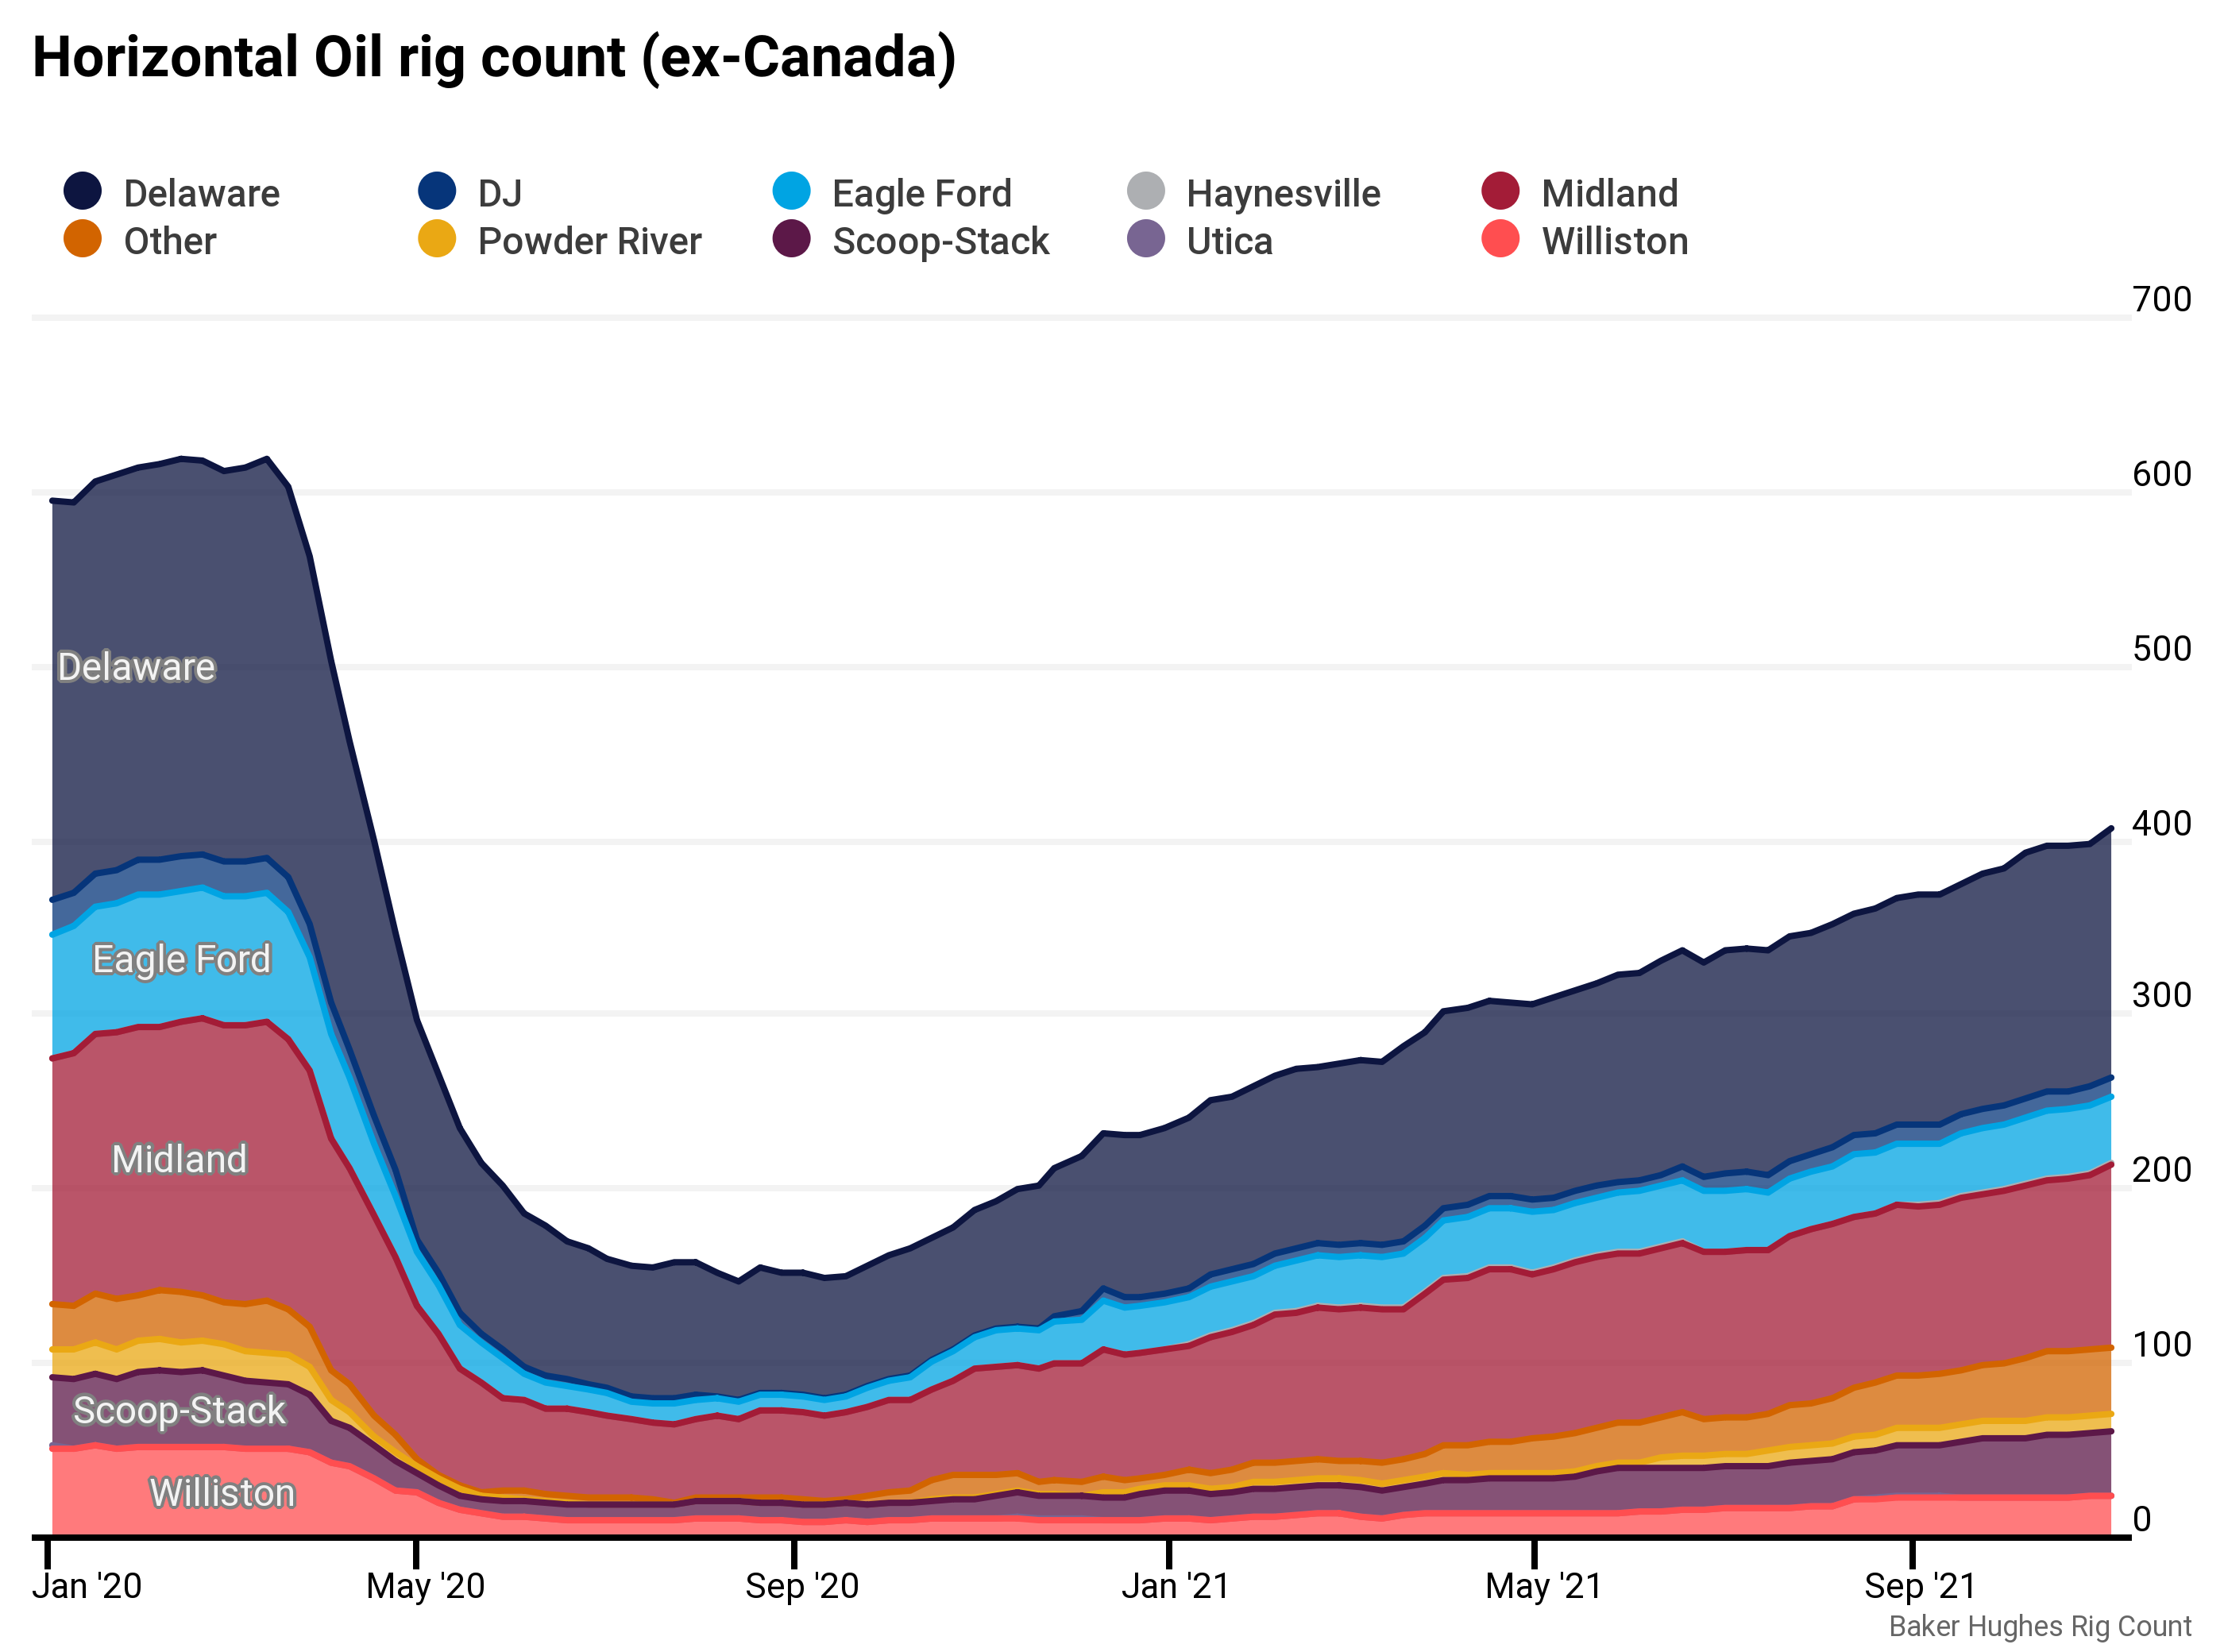
Where be the rigs
Only around 35% of oil rigs are outside of the Permian, with 25% of the total in the Bakken/Eagle Ford/SCOOP-STACK.

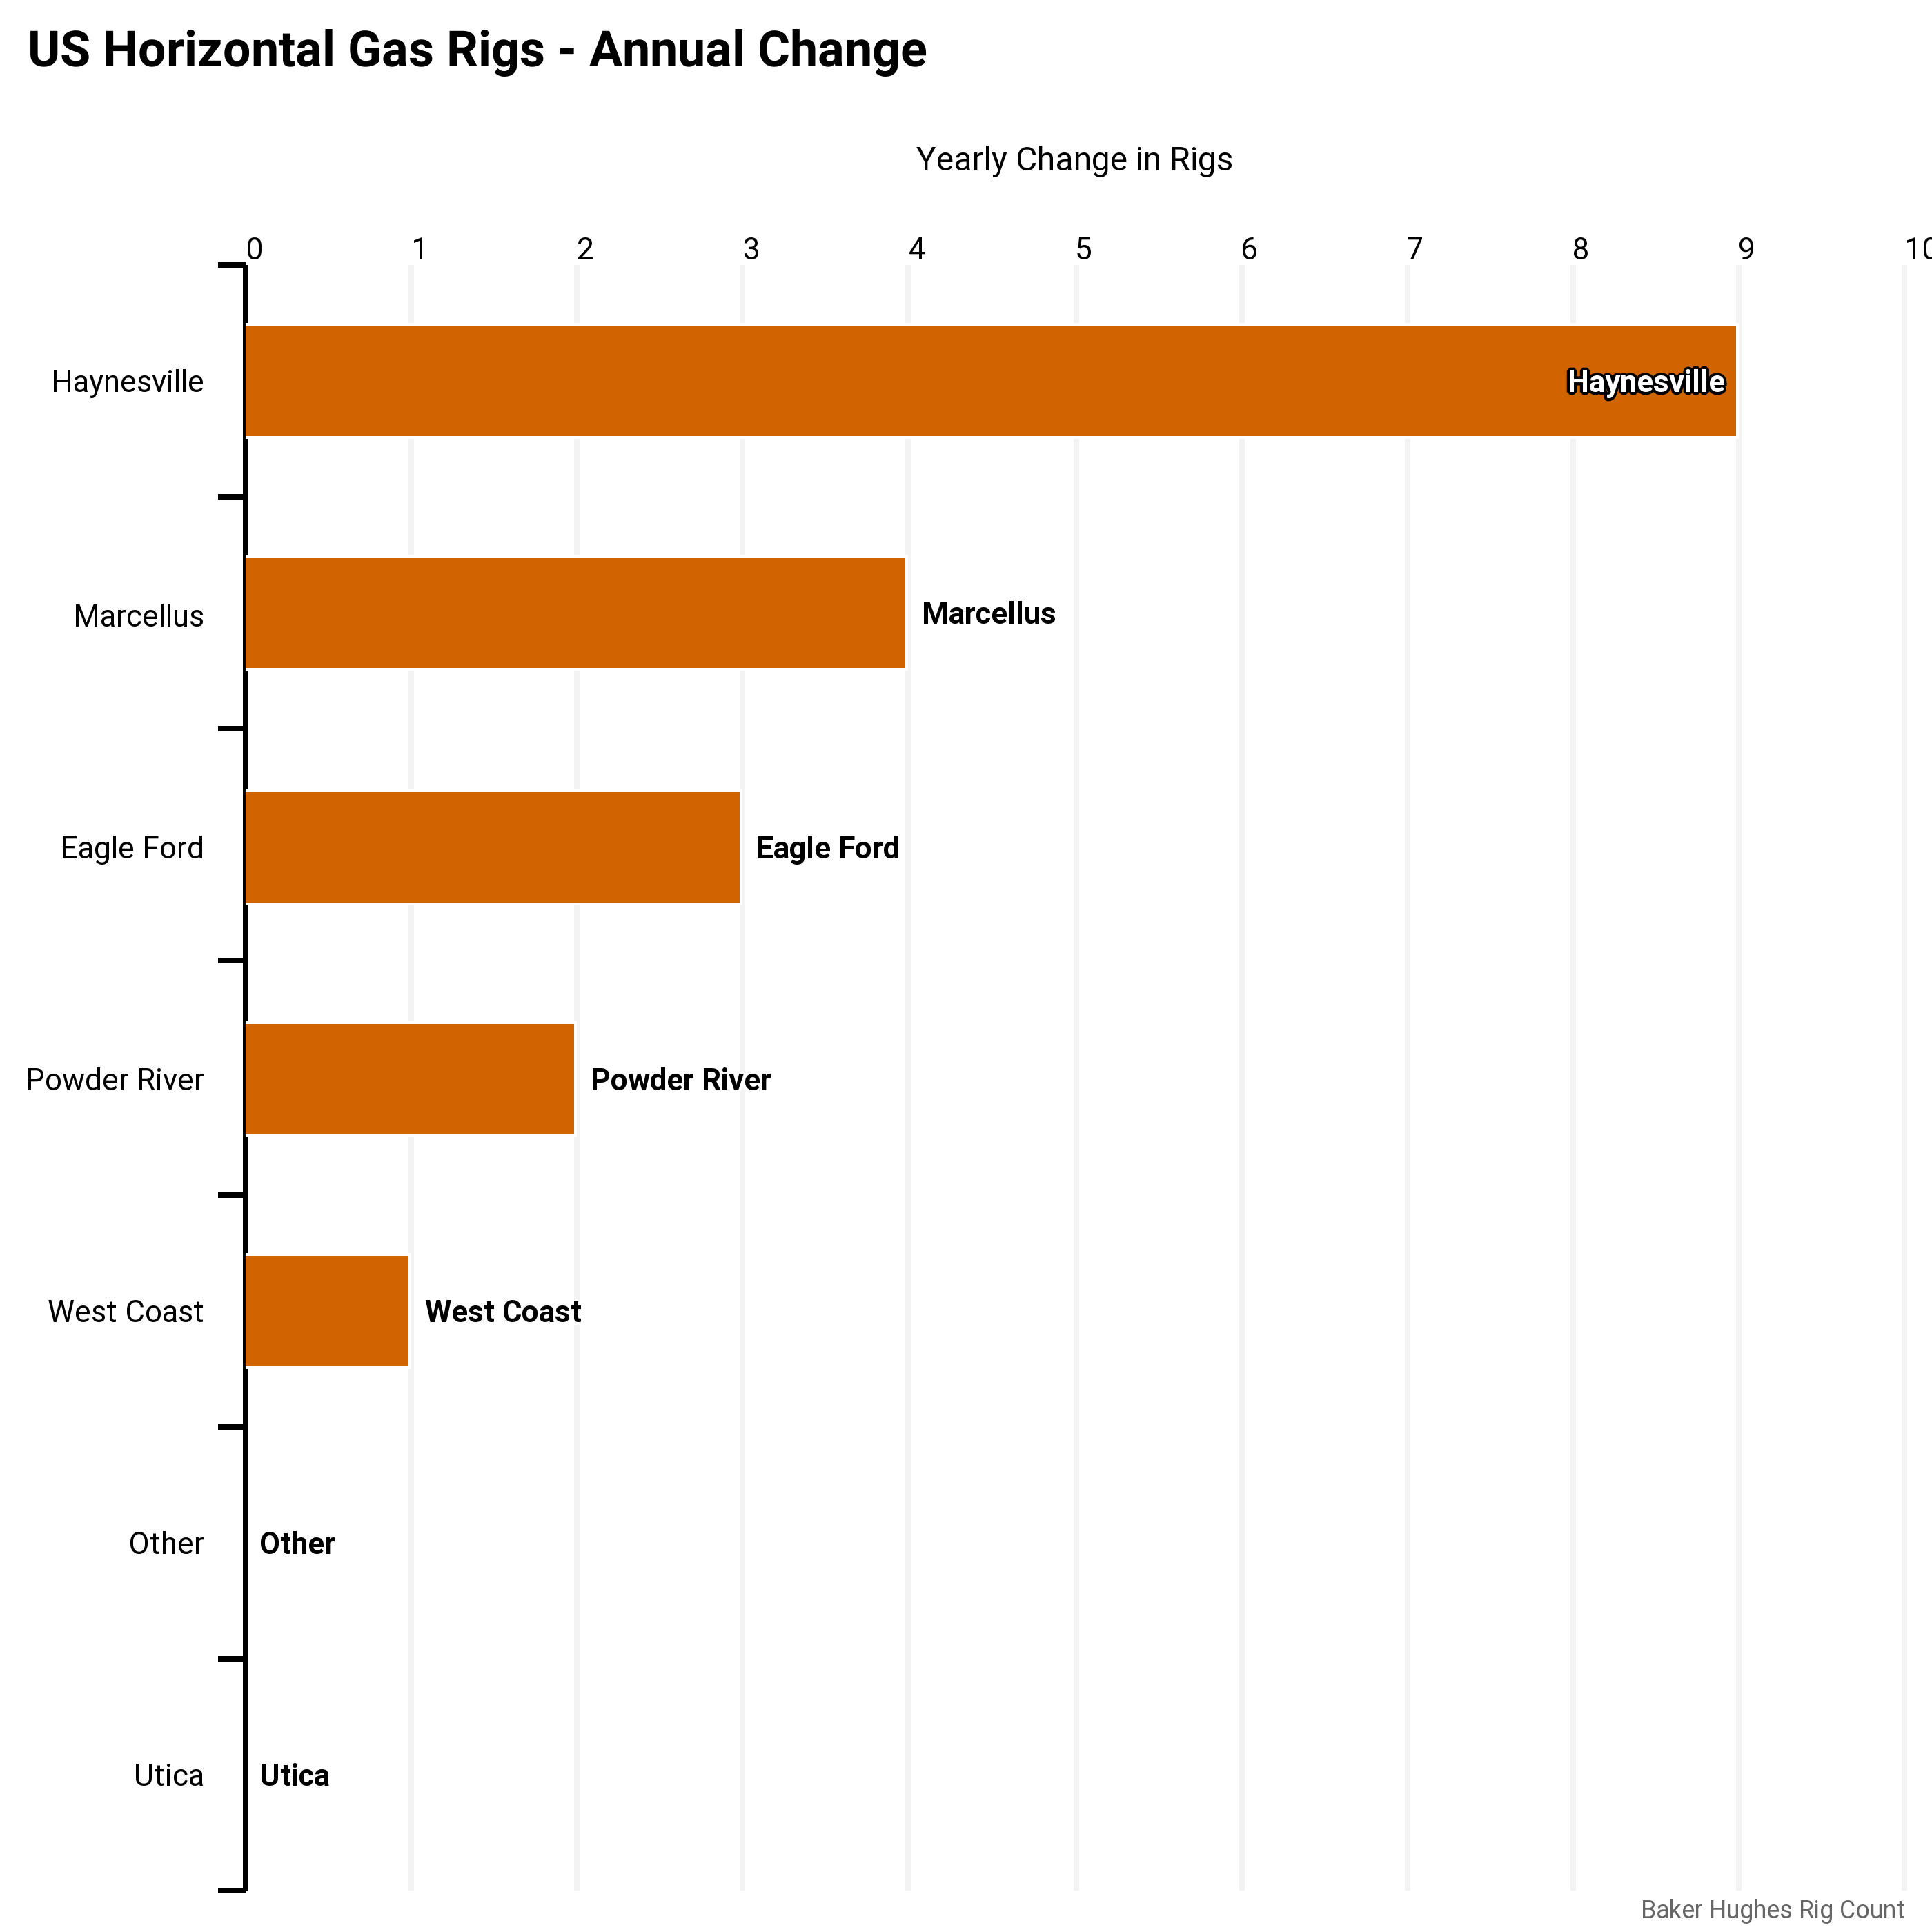
Gas rigs are heavly concentrated in the Haynesville/Marcellus (89%). Someone needs to come up with some new ideas.

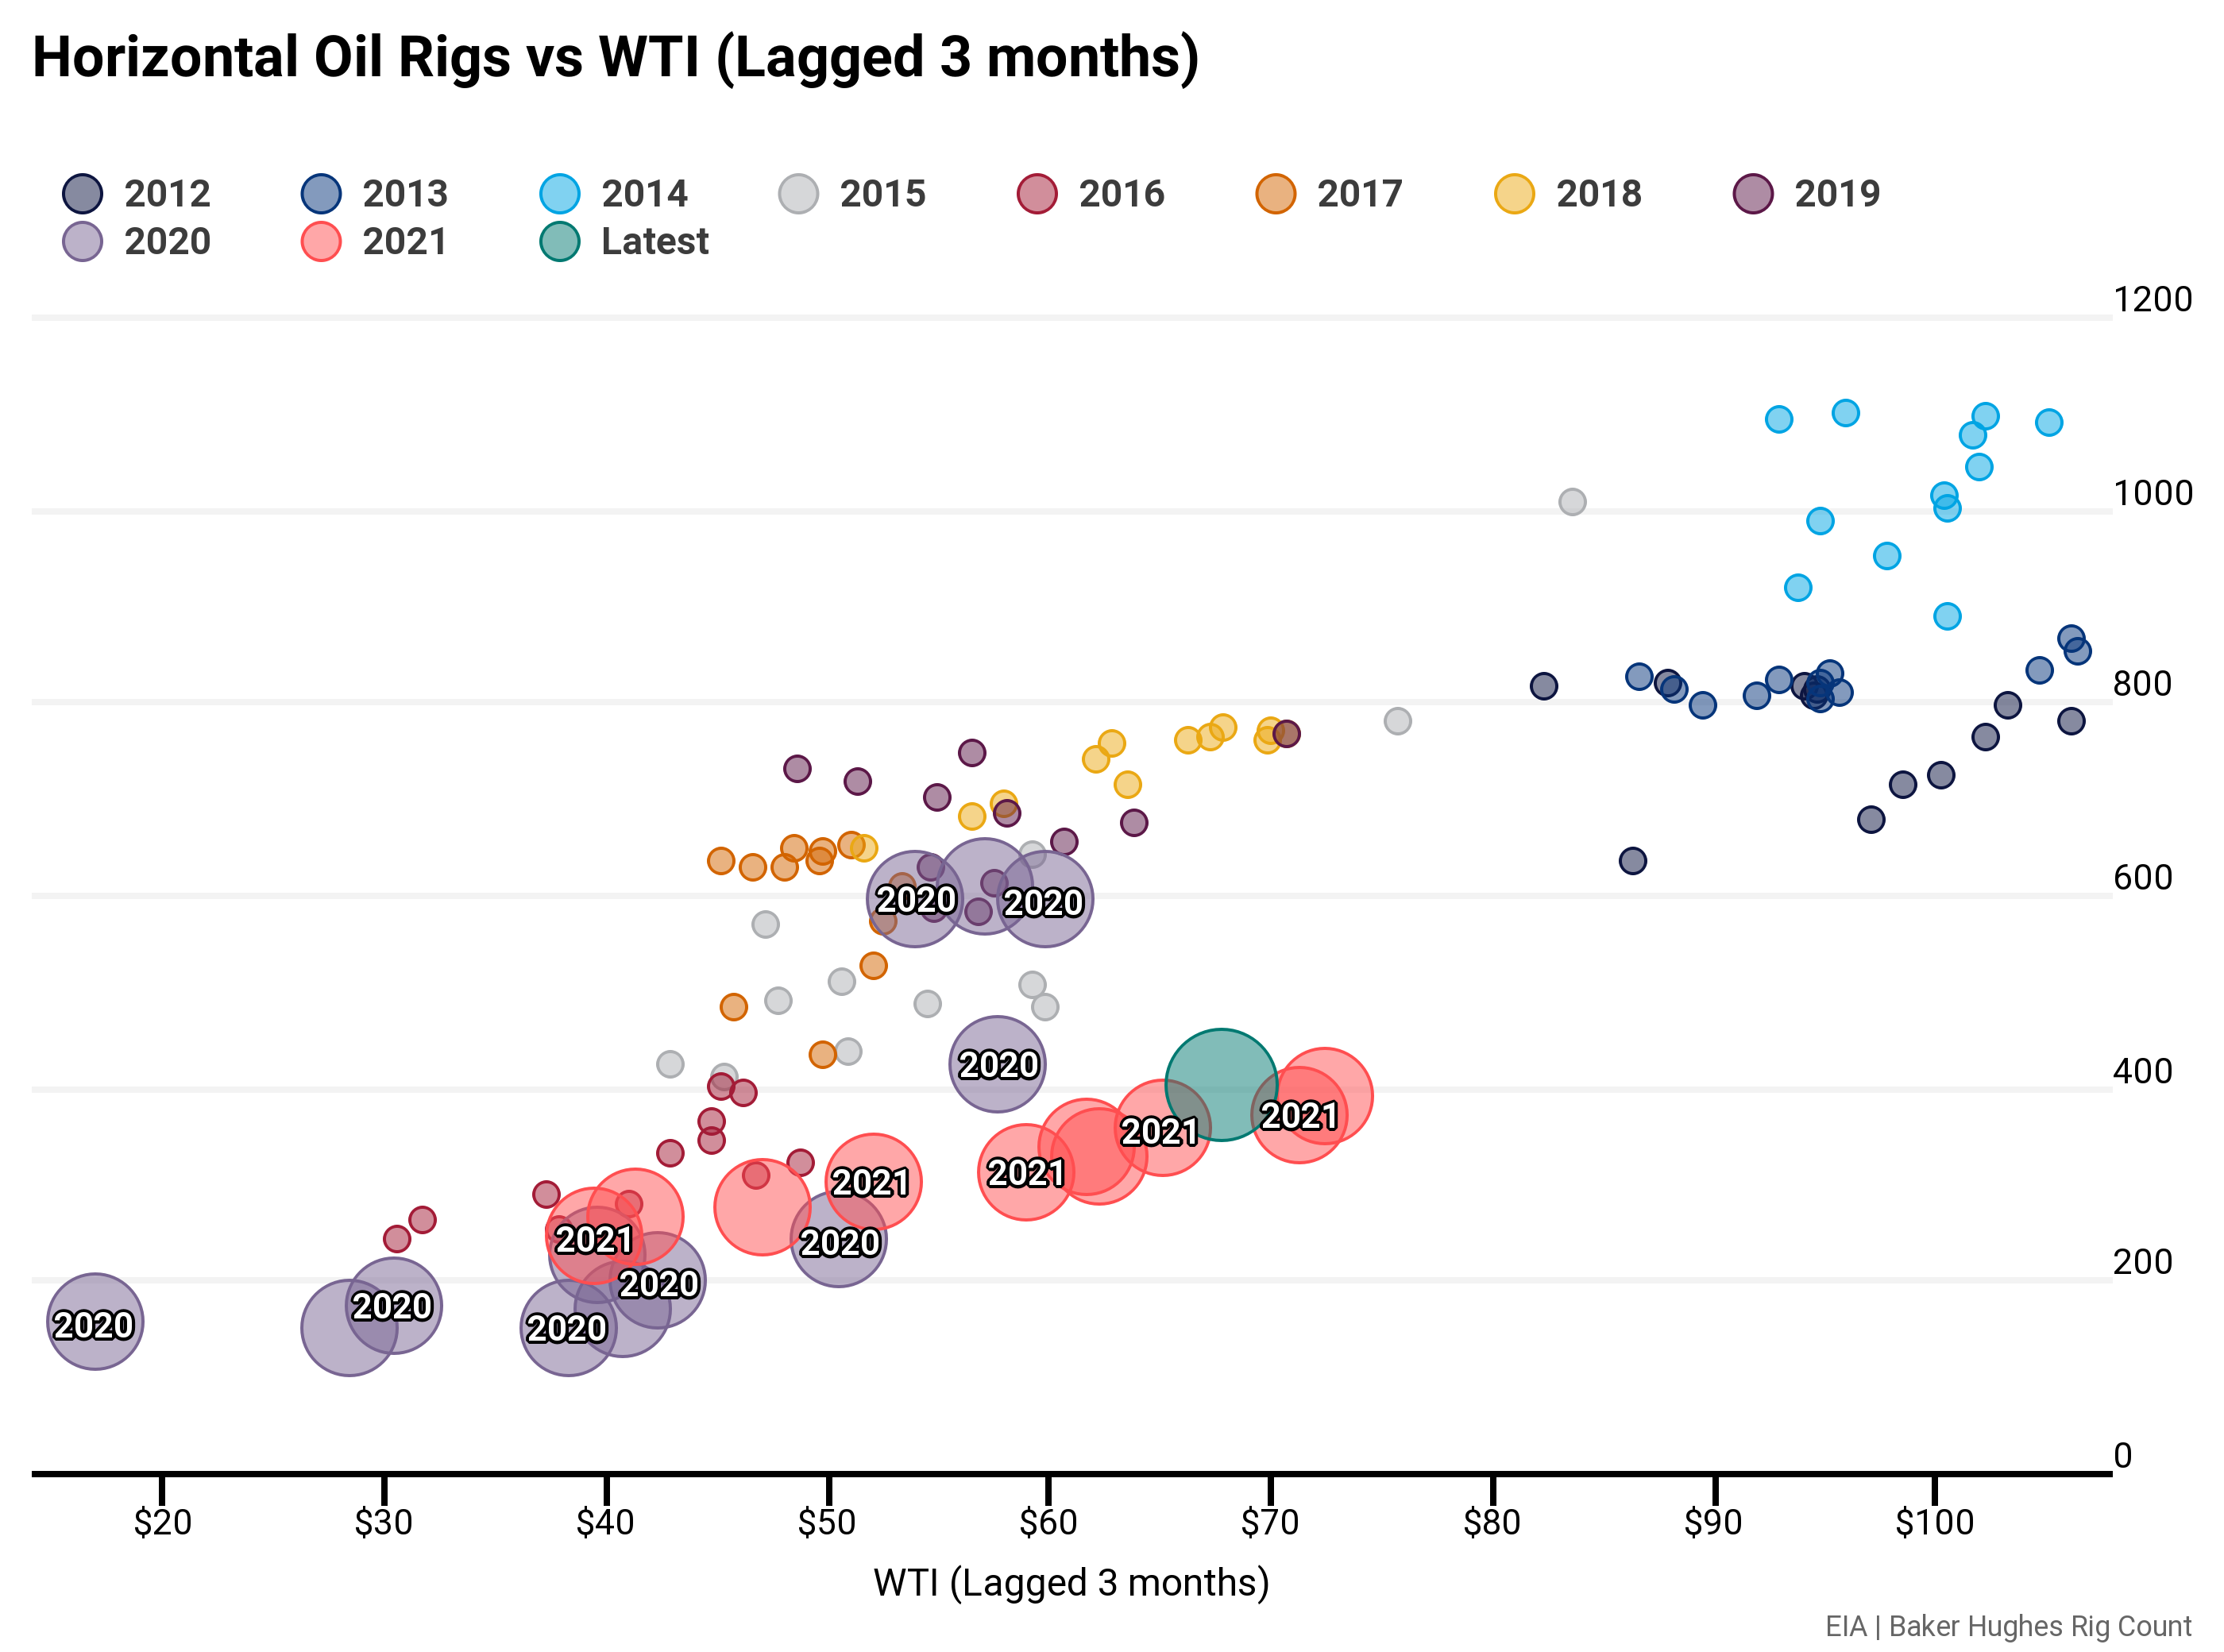
Price Correlation
With financiers moving away from shale players due to ESG-risks and poor historical performance, the historical rig count-price correlation has broken down. It’s likely that a new regime is here, as further risks such as downspacing and core depletion begin to rear their heads. Historically, at current prices you would see a rig count roughly double where it stands today.
Correlation (green) did manage to pick up a bit this last month. Maybe a sign of MOAR bullishness?
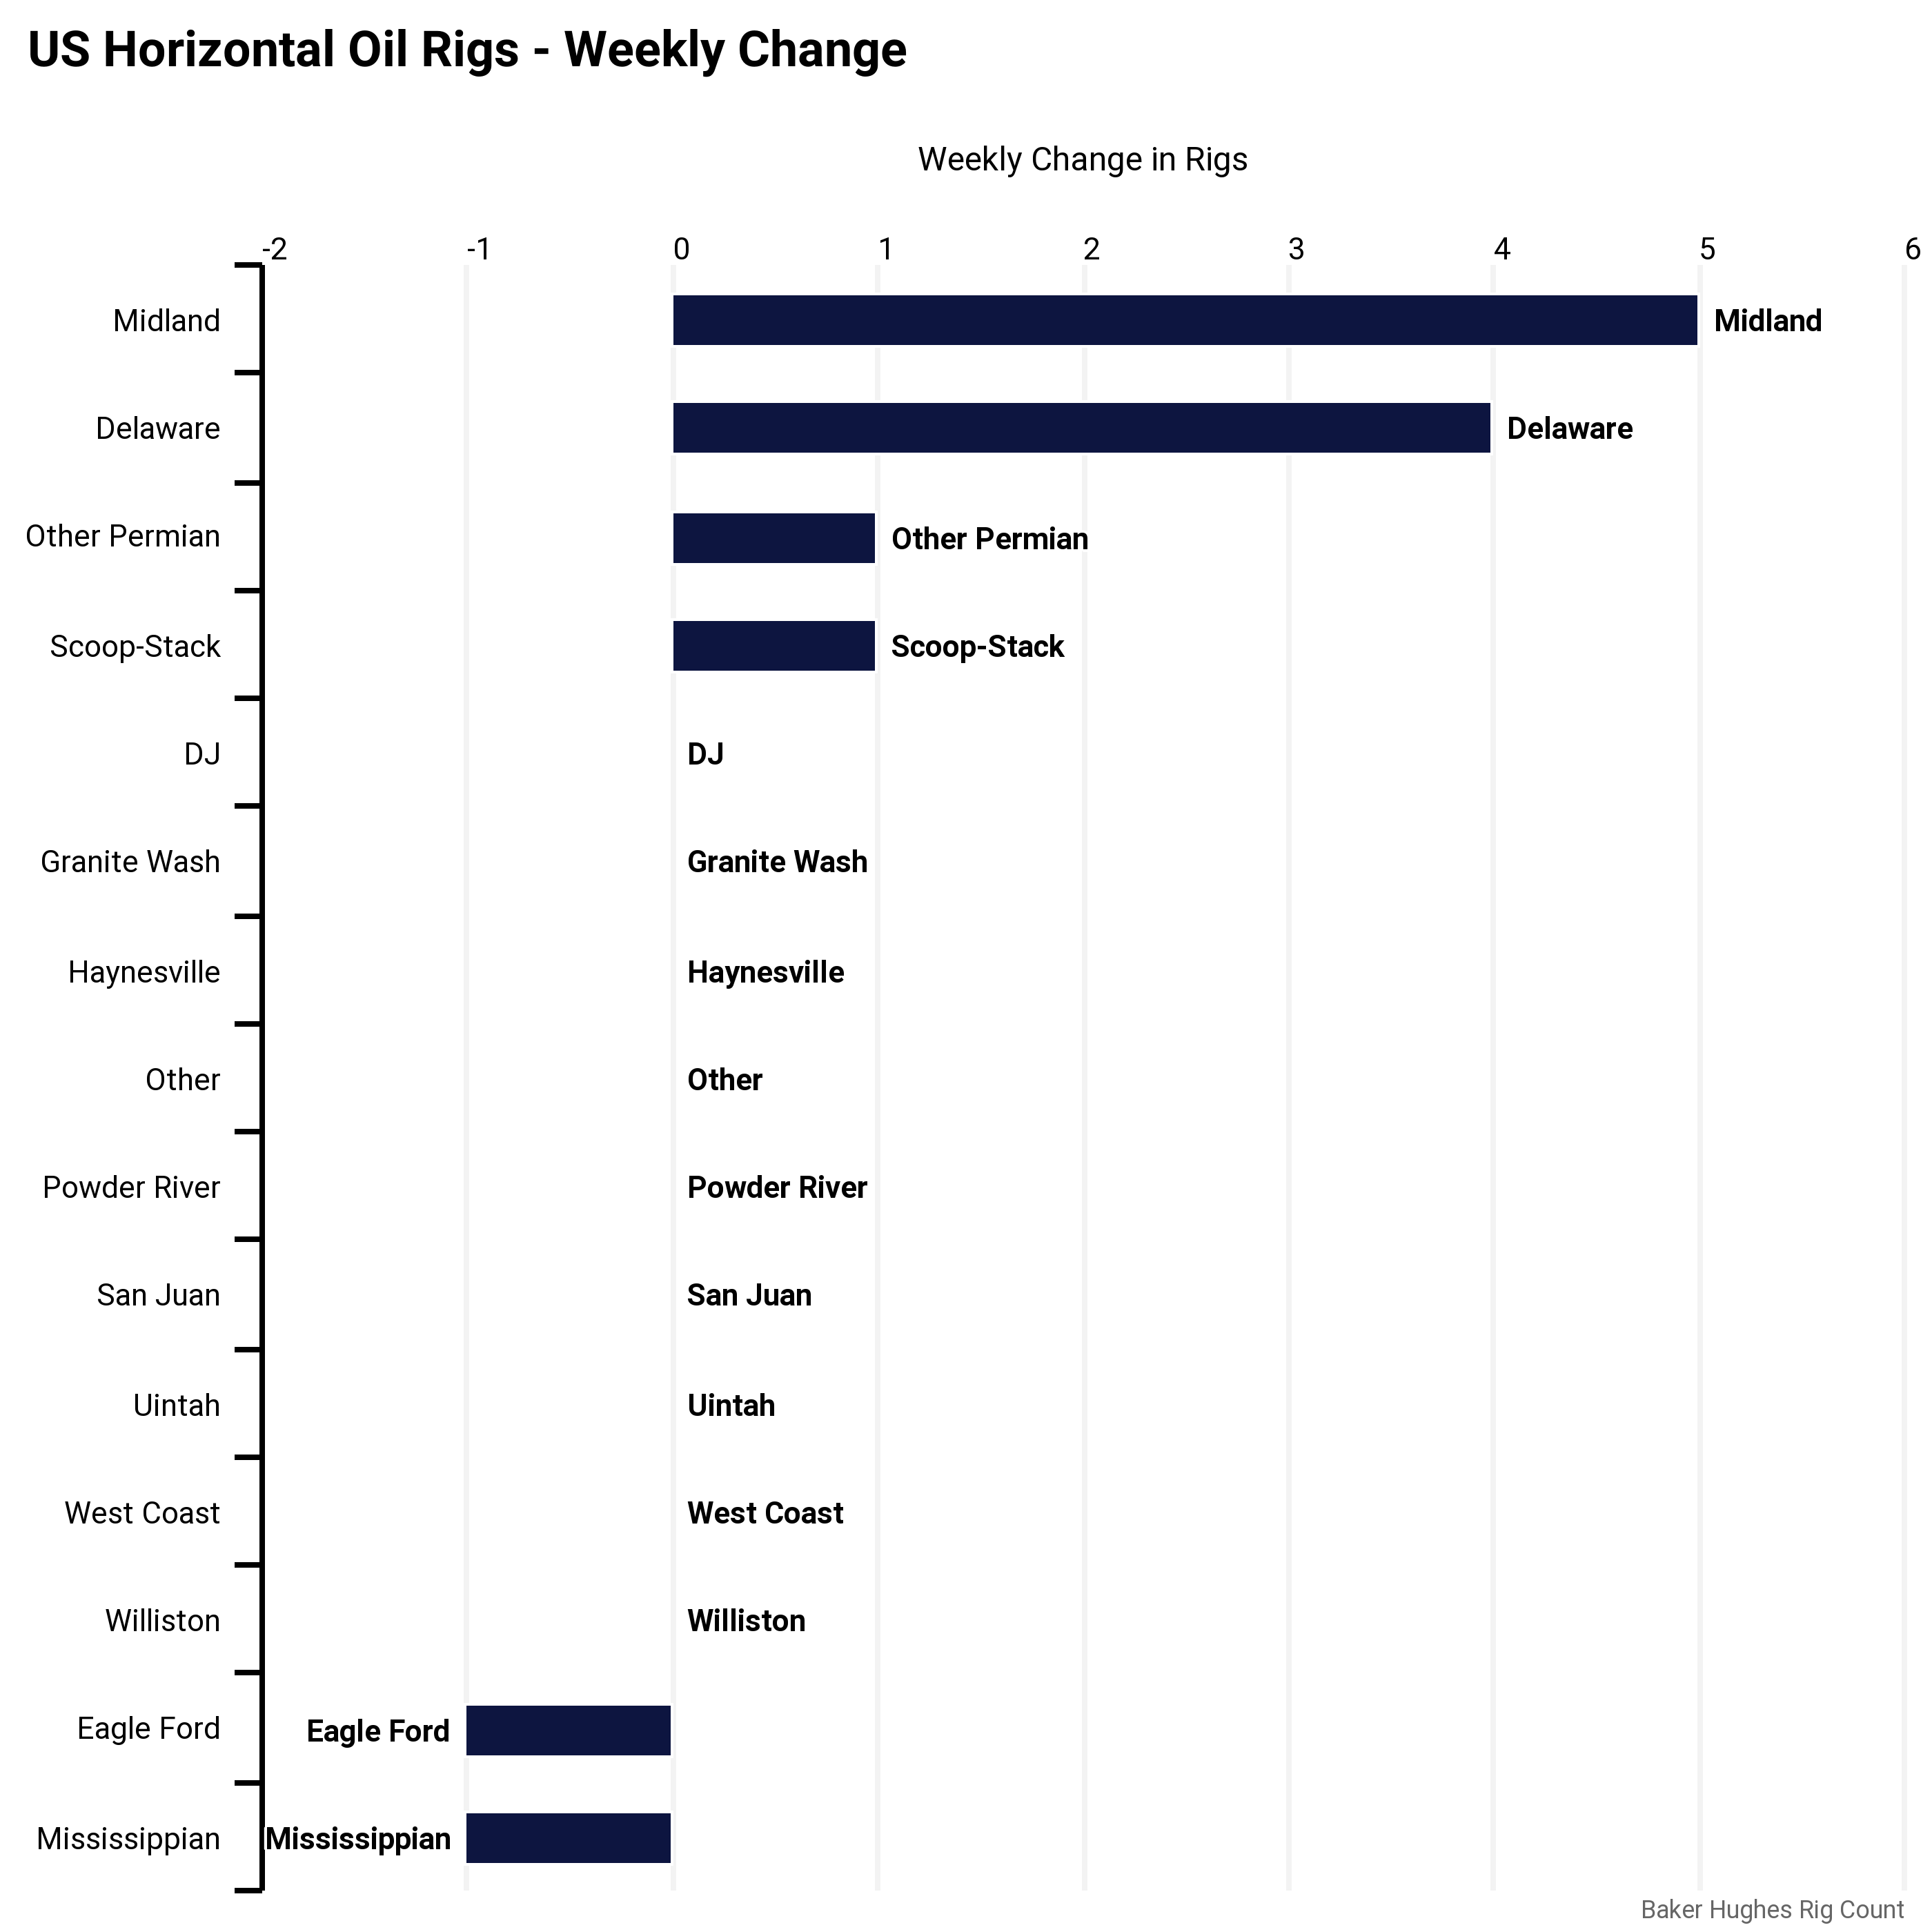
Change
Oil
Oil rigs made up the total gain in horizontals this week.
That increase was basically the Permian, with 10 rigs added, while Eagle Ford lost one and Oklahoma staying flat (Scoop-Stack and Miss).
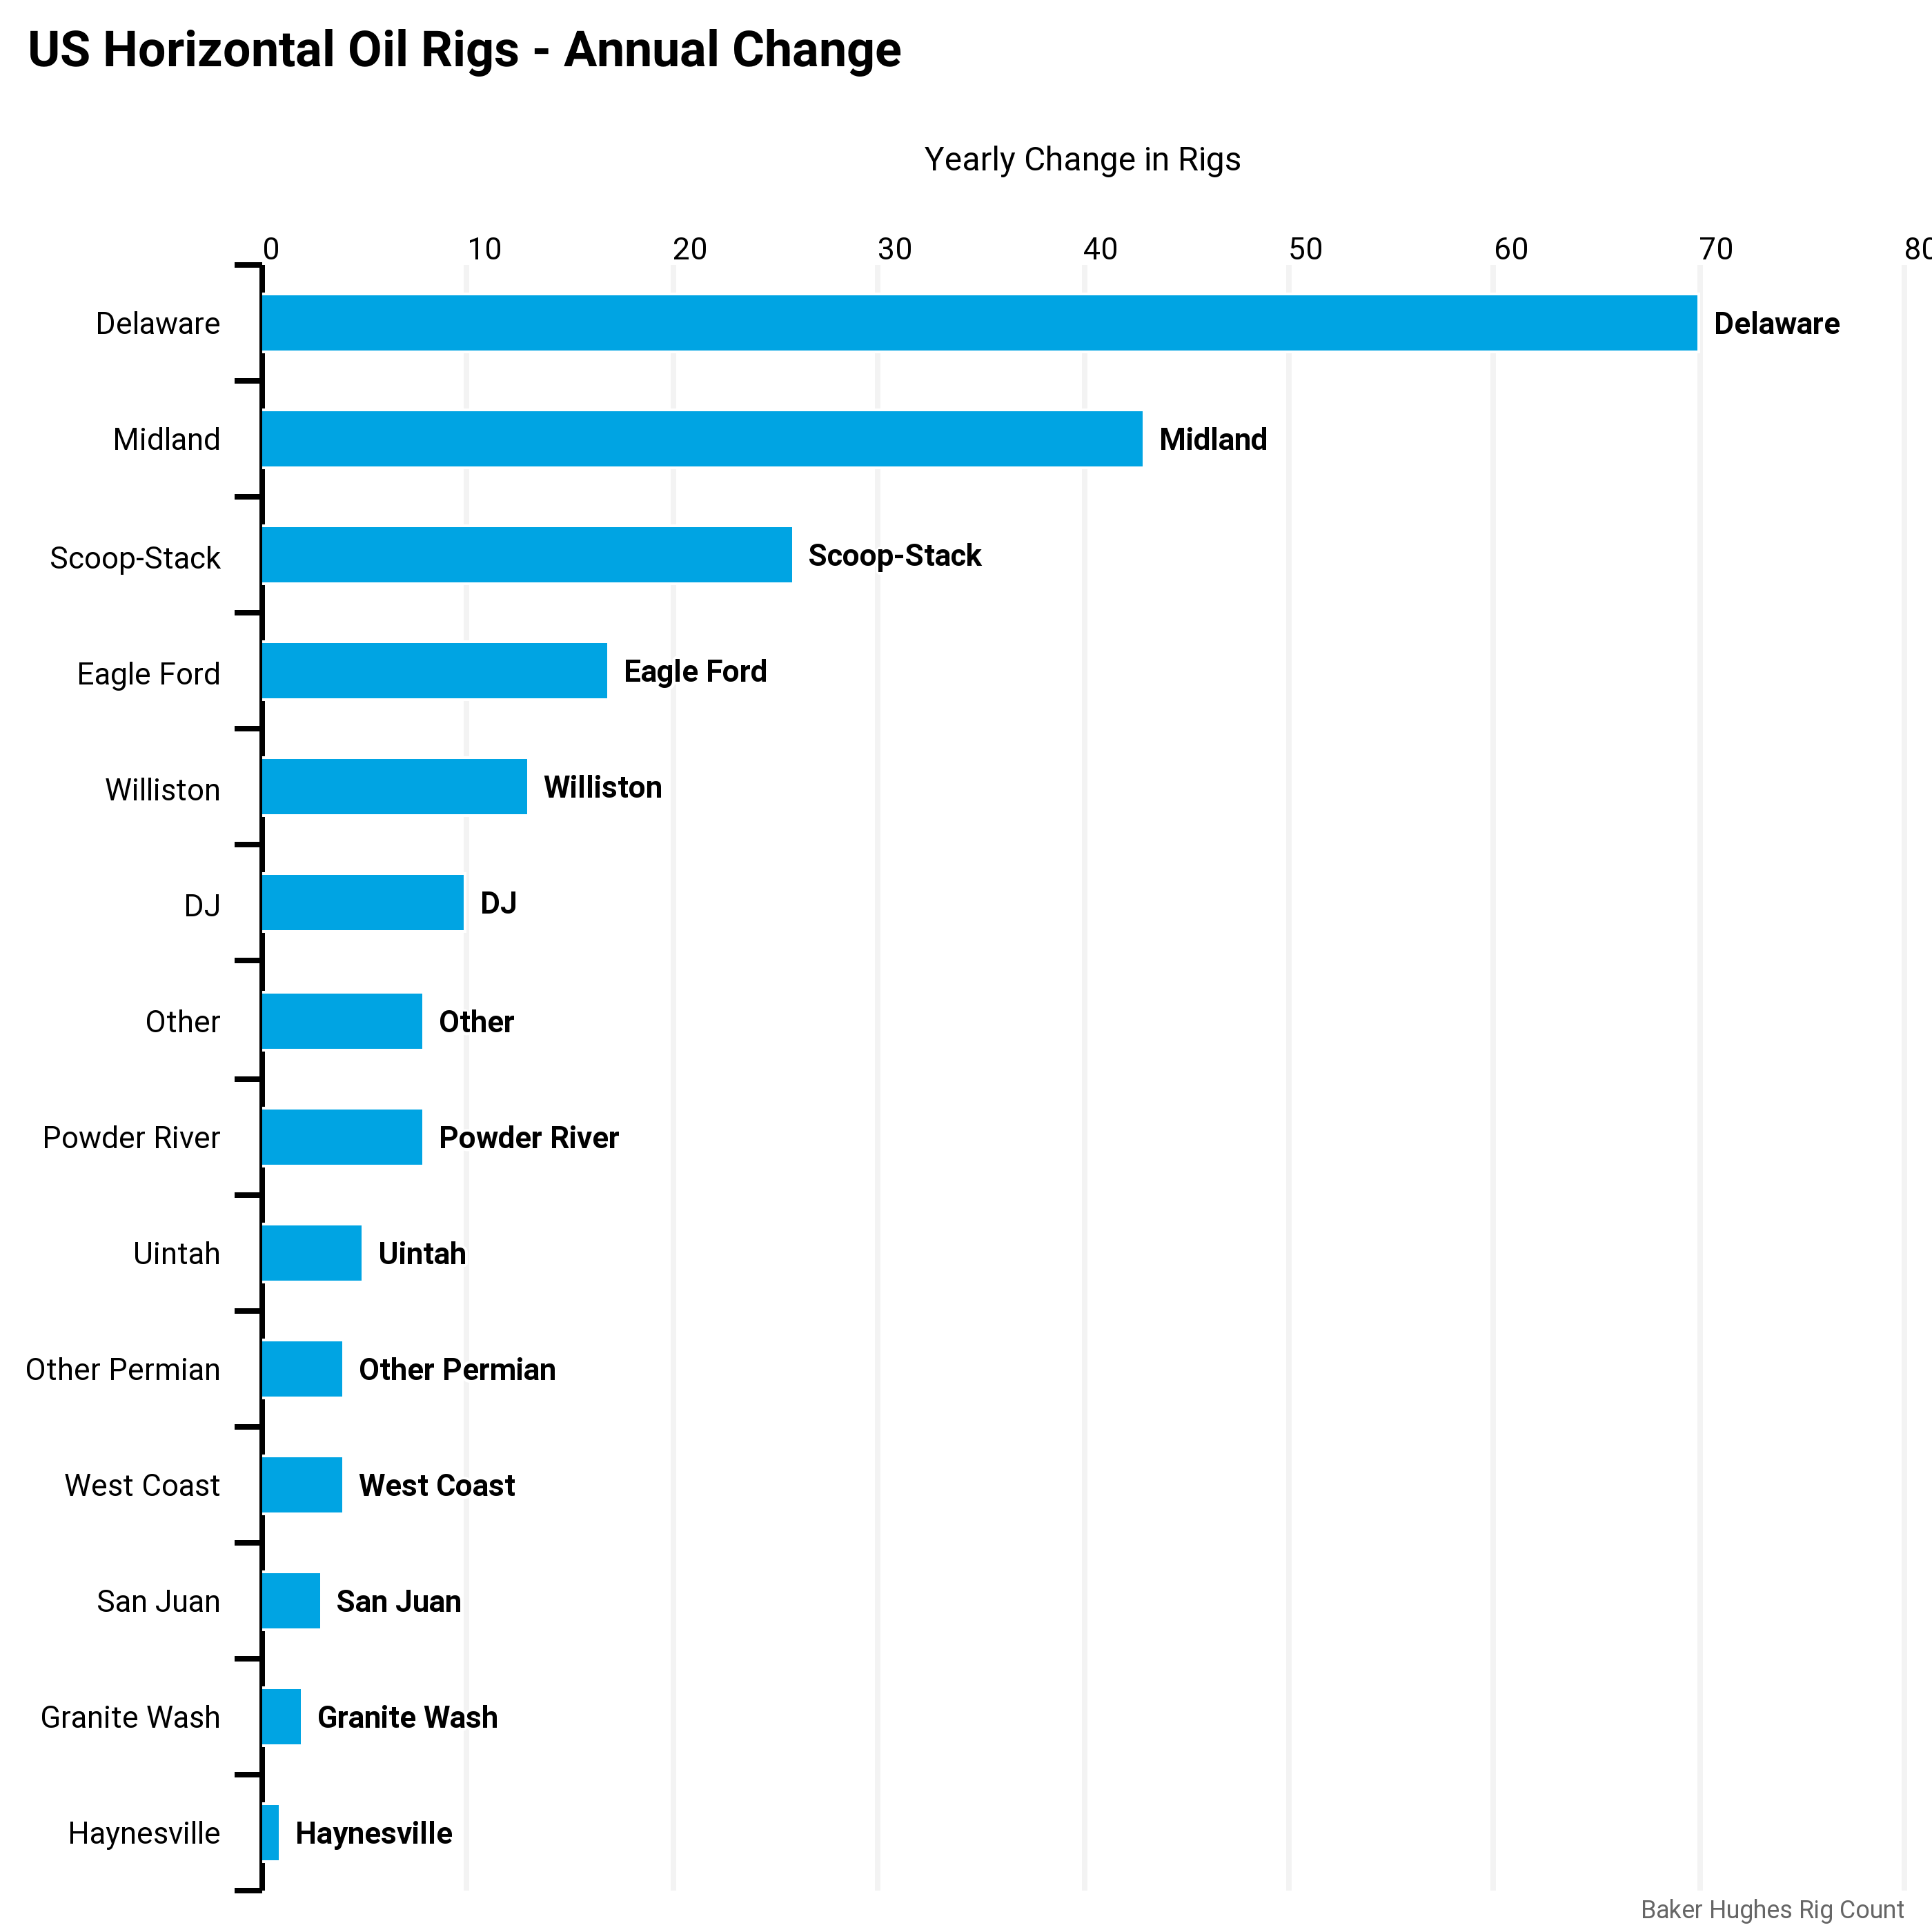
Permian leads annually, while Scoop-Stack is now within 1 oil rig of the Eagle Ford.
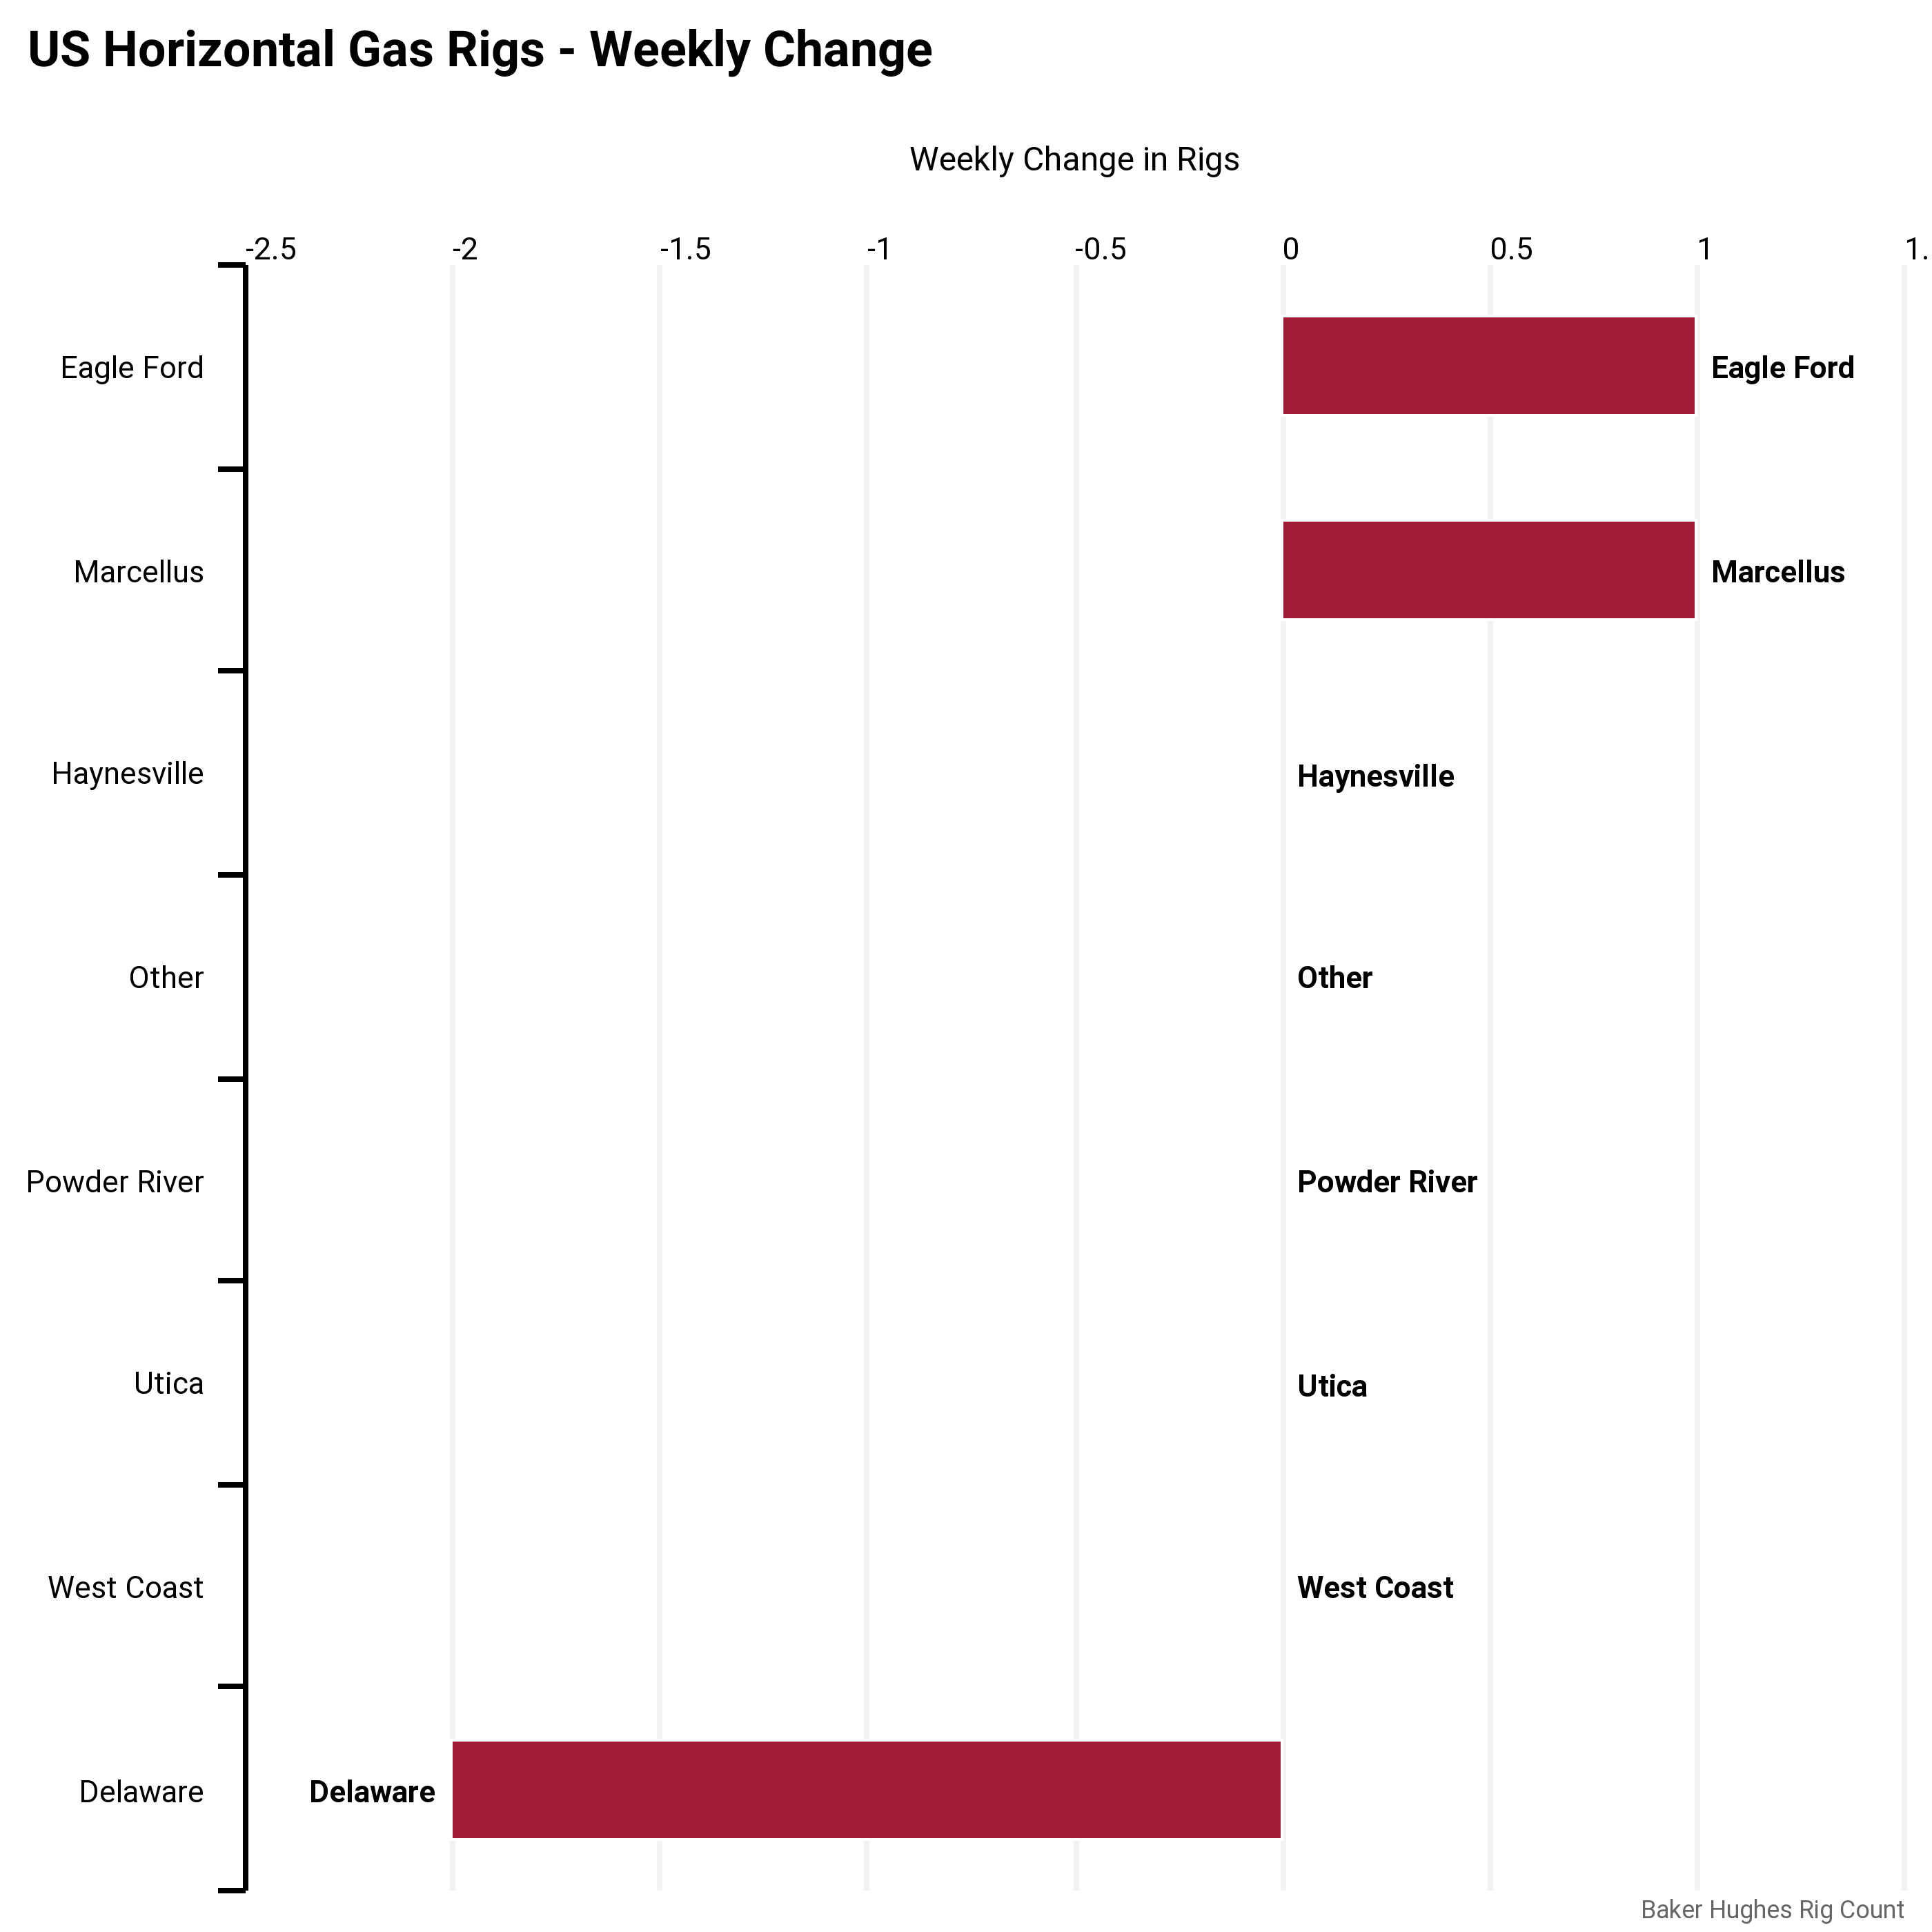
Gas
Gas rigs are still not responding to price signals. In fact, total rig count is down 12 from the May high.

Couple of gas rigs were dropped out of the Delaware, or maybe just got reclassifed to oil? Eagle Ford/Marcellus picked up one each.
Annually, the Haynesville leads the way, with total Appalachia up 4.